Enrollment Strategy


By Angela Brown, Head of Marketing
Your 2027 budget conversation will probably open with a percentage. Finance wants 5% back, or 8%, or "flat with inflation absorbed," and the fastest response is to trim every line by the same amount. That approach can preserve the channels that aren't producing students right along with the ones that are.
A better response starts with one number for every line in your recruitment budget: what it costs per enrolled student. Cut where that number is highest, move the money to where it's lowest and bring the numbers to the meeting before finance brings theirs. This post walks through how to build that model, where it will mislead you and how to turn it into a budget request by February.
Why 2027 budgets need a per-student number
The revenue behind each enrolled student is shrinking. NACUBO's latest Tuition Discounting Study estimates that the average discount rate for first-time undergraduates at private nonprofit colleges reached 57.1% in 2025-26, the highest point in at least a decade. Net tuition revenue per first-time, full-time undergraduate fell 2.2% after inflation in 2024-25.
You already know the demographic cliff story, so consider this a reminder of the timing. WICHE projects that U.S. high school graduates peaked in 2025 and will decline 13% by 2041, which puts the 2027 budget in the first stretch of that decline. The discounting data covers private nonprofits, but public institutions recruit from the same shrinking pool, and the model below works the same way for both.
Budget pressure also isn't new to anyone reading this. What's changed is who's asking for receipts. Only 13% of chief business officers say their institution understands per-student costs by program or activity very well, according to an Inside Higher Ed and Hanover Research 2026 survey. An enrollment leader who arrives with a defensible cost per enrolled student brings finance a number it rarely has.
We made a version of this argument in last year's budget guide. This year, the math gets its own post.
How do you calculate cost per enrolled student?
Divide what a channel cost over a full recruitment cycle by the number of enrolled students it produced in that cycle. A $90,000 travel budget that produced 45 enrolled students costs $2,000 per enrolled student.
The division is easy. The arguments start over what counts as cost and which students count as "produced." Settle both before you calculate anything, and write the parameters down so next year's numbers compare honestly with this year's.
What goes in the cost column. Include media spend, vendor and agency fees, list purchases, event fees and travel, and any software tied to the channel. Staff time belongs here too if you can estimate it at a loaded hourly rate. It's the line people skip, and skipping it makes counselor-heavy channels look “free” when they're consuming a third of your team's fall.
What goes in the student column. Count enrolled students at census, matched to the channel through your CRM. Deposits melt, and census counts don't. If a channel's students can't be matched to the student record at all, that's your first finding. Don't let messy data hold up the project, either. Start with the channels you can match, and report the unmatched share as its own line so finance sees it.
Who builds it. Pair whoever owns enrollment marketing with your CRM administrator and institutional research. IR's yield models already use much of the same data, and having their name on the model makes it harder to dismiss.
Here's what the model looks like for a hypothetical institution with $600,000 in recruitment spend. These numbers are examples, not benchmarks. The first-touch column credits the channel that found each enrolled student. The converting-touch column credits the last recorded touch before application or deposit.
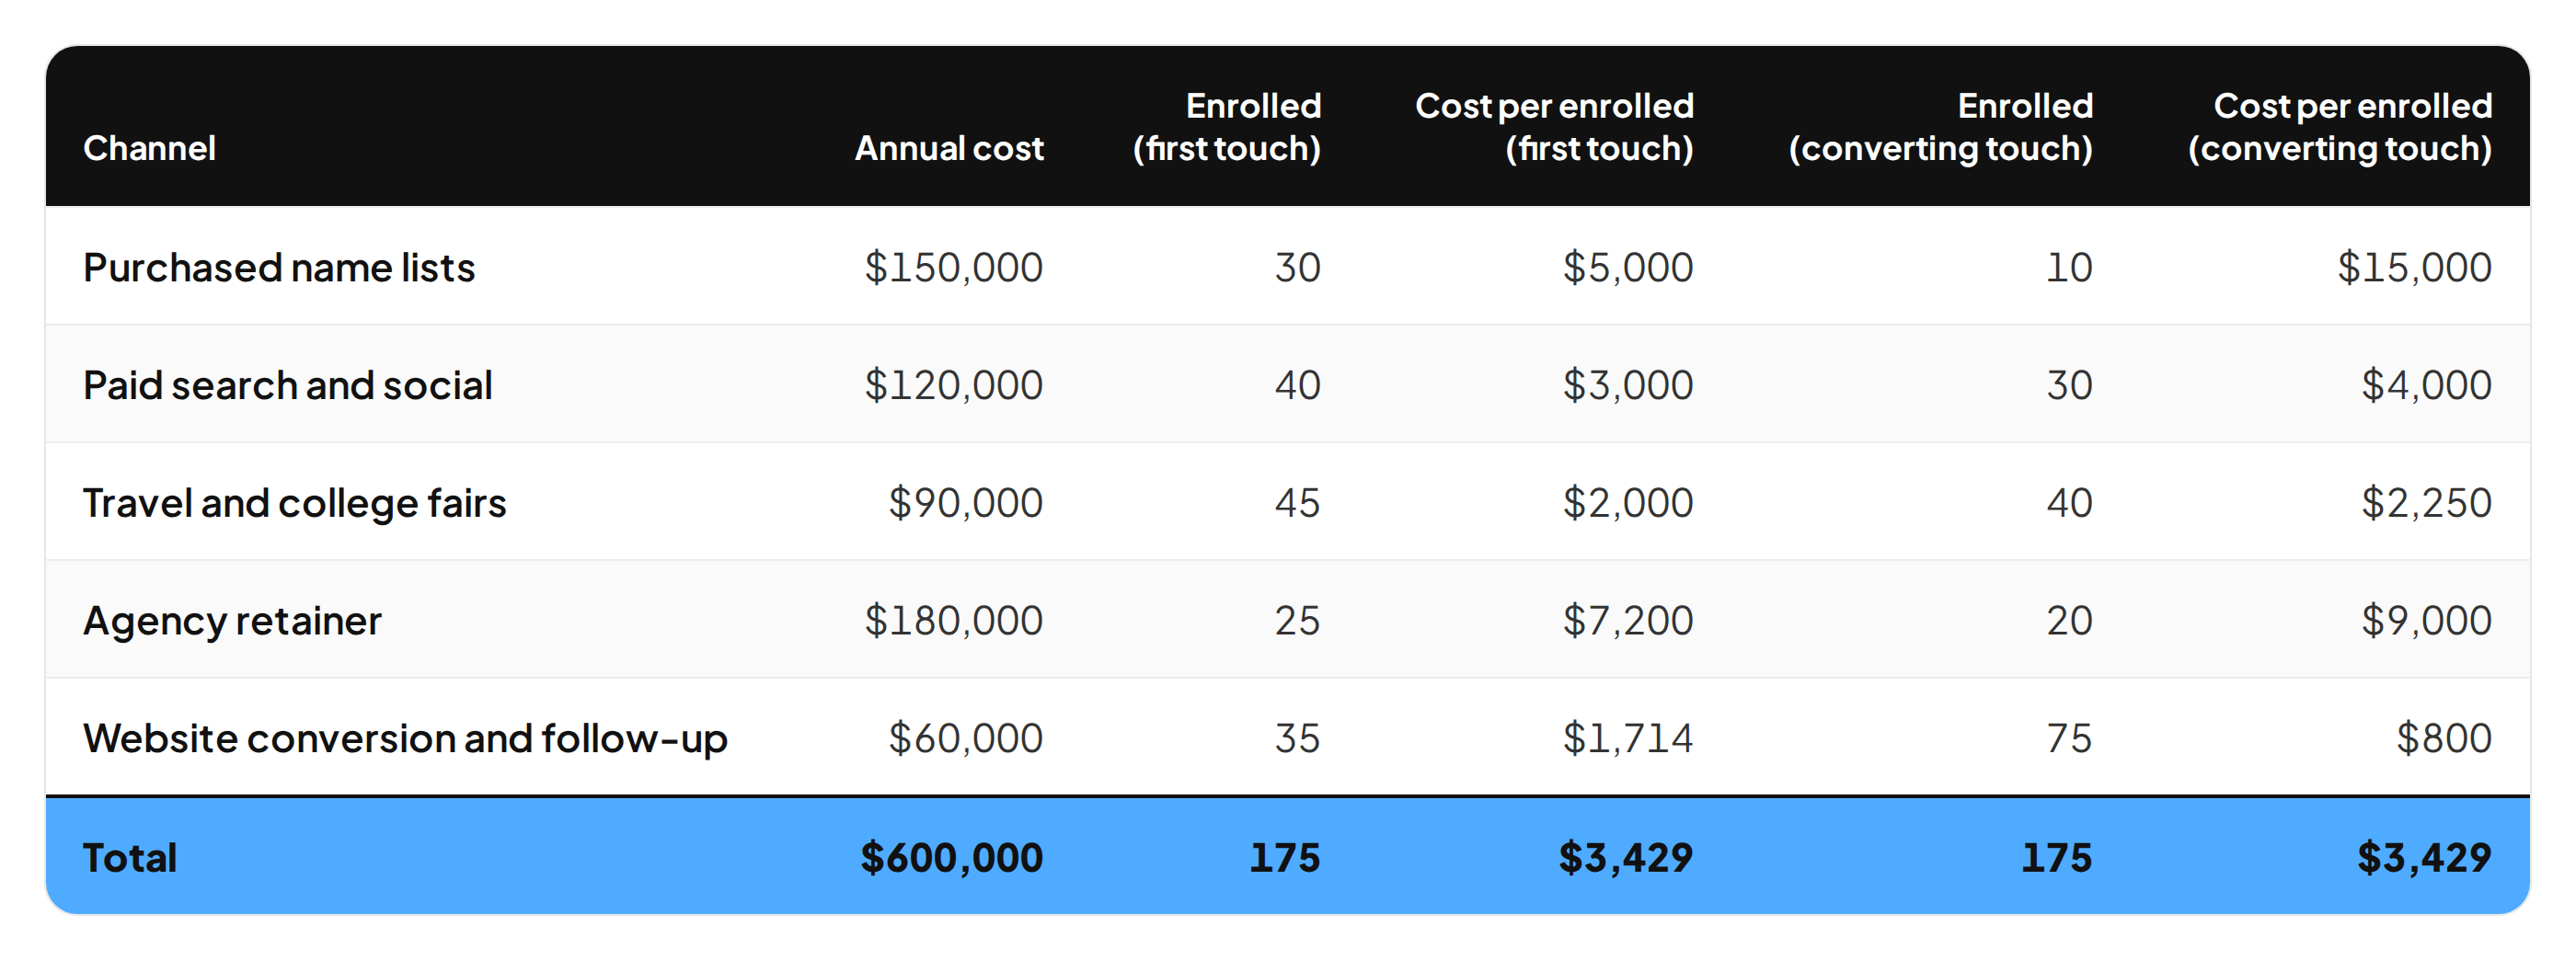
Read either column alone and the budget writes itself. Read them together before you cut anything.
Where the model will mislead you
A single attribution rule tilts your results in a predictable direction. First-touch gives credit to whatever found the student, and converting-touch gives credit to whatever closed the deal. A student who came from a purchased list, ignored three emails, visited campus and then answered a text the week before the deposit deadline counts as a "list" student in one column and a "follow-up" student in the other.
That's why the table has both. In the example, the agency retainer costs $7,200 or $9,000 per enrolled student depending on the view, so it's expensive either way. Purchased lists look reasonable at $5,000 per first-touch student and terrible at $15,000 per converted student, because lists find names and other channels close them. Website conversion and follow-up looks cheapest of all at $800, partly because it's converting names the lists paid to find. Cut the lists without replacing that sourcing, and the follow-up numbers will slide next year.
- A channel that's expensive in both views is a real cut candidate.
- When a channel is expensive in one view and cheap in the other, it's doing a specific job. Decide whether you still need that job done, and whether something cheaper can do it.
- Channels you can't measure in either view need a different conversation, and it should happen with the vendor before renewal.
Plan for two more traps. Averages hide margins: your cheapest channel won't stay cheap if you triple its budget, so reinvest in steps and measure each one. Timing also matters. Outreach to high school juniors this year enrolls students next year, so judge those channels on a two-cycle cohort.

What to cut first
Start with the lines that fail in both attribution views, then look for these patterns.
Declining inquiry volume. Compare each channel's inquiry-to-application rate with your overall rate. A channel that delivers thousands of names and a fraction of your usual application rate is flattering itself with the inquiry count. Purchased name lists and paid digital deserve the closest look here, because both are designed to generate volume.
Two tools contacting the same student. Prospects we've spoken with this year name over-communication as a real problem, with several offices and vendors messaging the same student in the same week. When two platforms send messages to the same segment, keep the one whose results you can see on the student record.
Bundled retainers. Agency contracts often combine creative, media and search into a single invoice, which makes per-student math impossible until you pull them apart. Our breakdown of what an enrollment agency retainer buys can help you itemize yours before renewal.
Work that only happens because one person does it by hand. If a campaign depends on a counselor rebuilding a list every Monday, it will stop the week that person gets busy. Price that staff time into the model, and the channel may look less efficient than it seemed.
Where to reinvest the savings
Put the money where students have already raised a hand and then gone quiet. A student who inquired has already absorbed your acquisition cost. Converting more of those students lowers the cost per enrolled student of every channel upstream at the same time. If 10% more of your inquiries enroll, every line in the table above gets about 9% cheaper per enrolled student, because the same spend now produces more students.
Partner results from last cycle show what that looks like. Between Aug. 9 and its Aug. 28 enrollment deadline, Halda generated 88 inquiries for Spring Hill College, and eight of those students enrolled. Forty-three of the 88 came through a scholarship calculator. Siena University's merit scholarship calculator converted 8.55% of visitors into inquiries. We covered both in three enrollment campaigns converting students right now, along with the daily counselor routine that made Spring Hill's numbers possible.
The highest-return reinvestments usually sit in a few places:
- Response time after an inquiry, including nights and weekends, when your office is closed and students are still researching.
- Application completion, since a started application that stalls has already cleared the most expensive part of the funnel.
- Program pages that turn traffic into inquiries. Our program-page conversion playbook walks through the fixes.
- Yield-season outreach between admission and deposit, when a well-timed text can matter more than another viewbook.
This converting stage is where Halda works. Halda answers and follows up with students across web, email, SMS and voice, and it learns from each interaction so the next message builds on the last. For a cost model, the record matters as much as the outreach. At Siena, Halda forms feed two separate Slate instances, and every content-card link carries a UTM code, so the marketing team can follow a student from first click to event to enrollment. A follow-up tool that reports results only in its own dashboard can't be checked against your census file, and anything you can't check will be the first line finance questions.
A budget timeline from November to February
November: Pull last cycle's census list and match each enrolled student to a source channel and a converting channel in your CRM. Fall census numbers are final by now, so this is the cleanest data you'll have all year.
December: Build the model in both views and flag every channel where they disagree. Those disagreements are where your hardest conversations will happen, so have them with your team first.
January: Finance is setting next year's assumptions now. Share your draft model with the budget office early, before the numbers harden, and pick one reinvestment you can test in steps.
February: Submit the budget request with the model attached. A request that shows which lines you cut, why you cut them and what each reinvested dollar should return is harder to trim than a request built on percentages.
FAQ
What's a good cost per enrolled student?
There isn't a reliable public benchmark that fits your institution. Published figures vary widely by institution type and by what each survey counts as cost, so your own number, tracked year over year under the same rules, tells you more than a national average.
Should staff salaries count?
Yes, if you can estimate them consistently. Keep staff time in its own column so you can show the model with and without it. Finance will want to see both.
How do I count a student who touched five channels?
Use the two-view method above: credit the sourcing channel in one column and the converting channel in the other. Splitting credit across every touch sounds more precise, but it depends on clean tracking that many teams don't have yet. Start with two views you can defend, and add detail once the data supports it.
________________
As Halda’s Head of Marketing, Angela Brown brings more than 15 years of experience leading marketing and content teams in education and B2B SaaS. When she isn’t at her computer, you can find her reading, watching a true crime documentary, or driving her son to basketball practice.